
Objective
In this article you will learn how to view the Document Management module dashboard , use the available filters, and interpret the displayed indicators.
Prerequisites
- Having the "View all tasks" permission allows the user to view the Documents module dashboard. To learn more about permissions in the Documents module, click here.

1. In the Documents module , click the Dashboard tab .

2. Filters are available at the top of the screen to refine the displayed information.
Organizational unit
Select the organizational unit to view only the documents related to the chosen unit.
Process
Select a process to display only the documents linked to the specified process.
After selecting the desired filters, click the Search icon .

3. The dashboard displays the following panels:
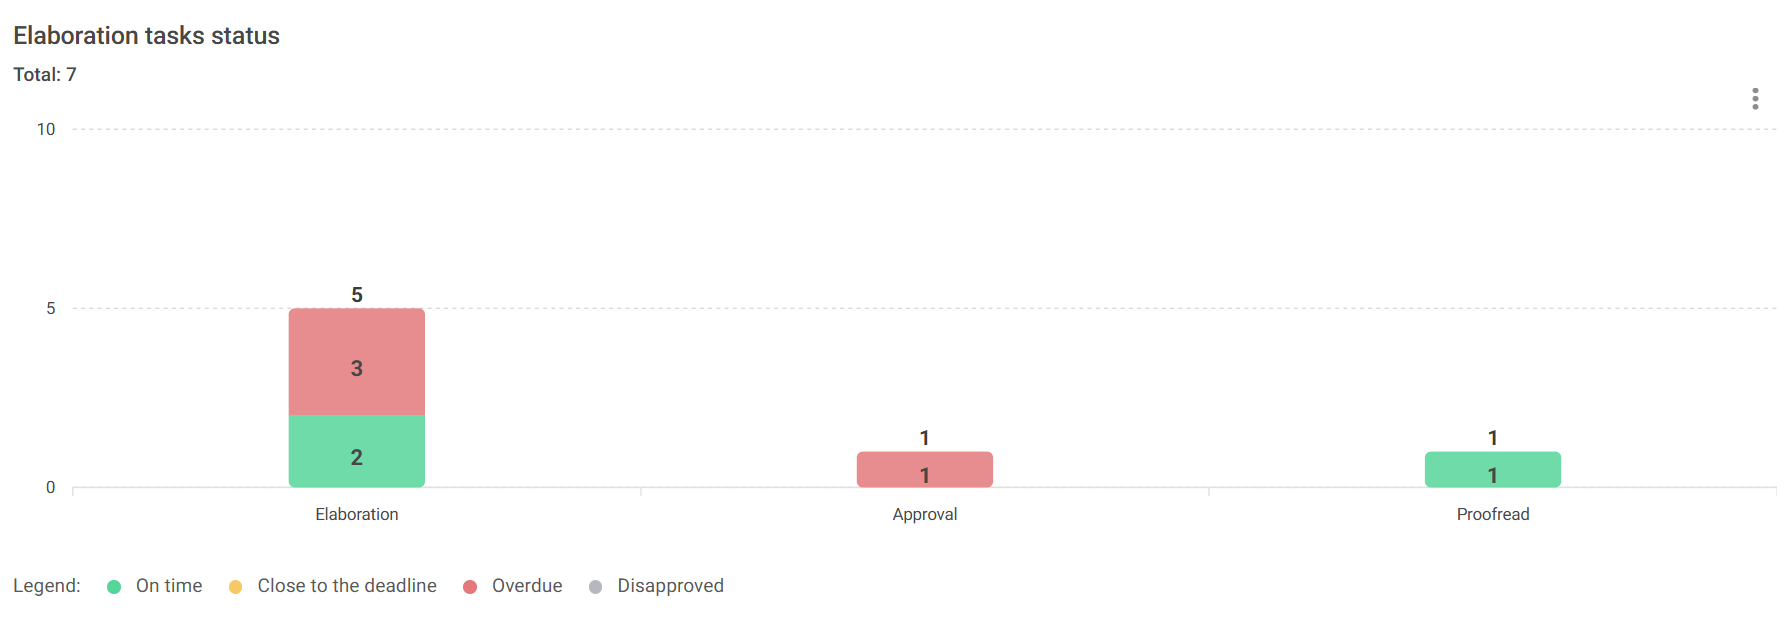
Status of drafting tasks
It presents the tasks of Drafting , Approval, and Consensus , classified according to the situation:
- On time;
- Winning;
- Delayed;
- Failed (where applicable).
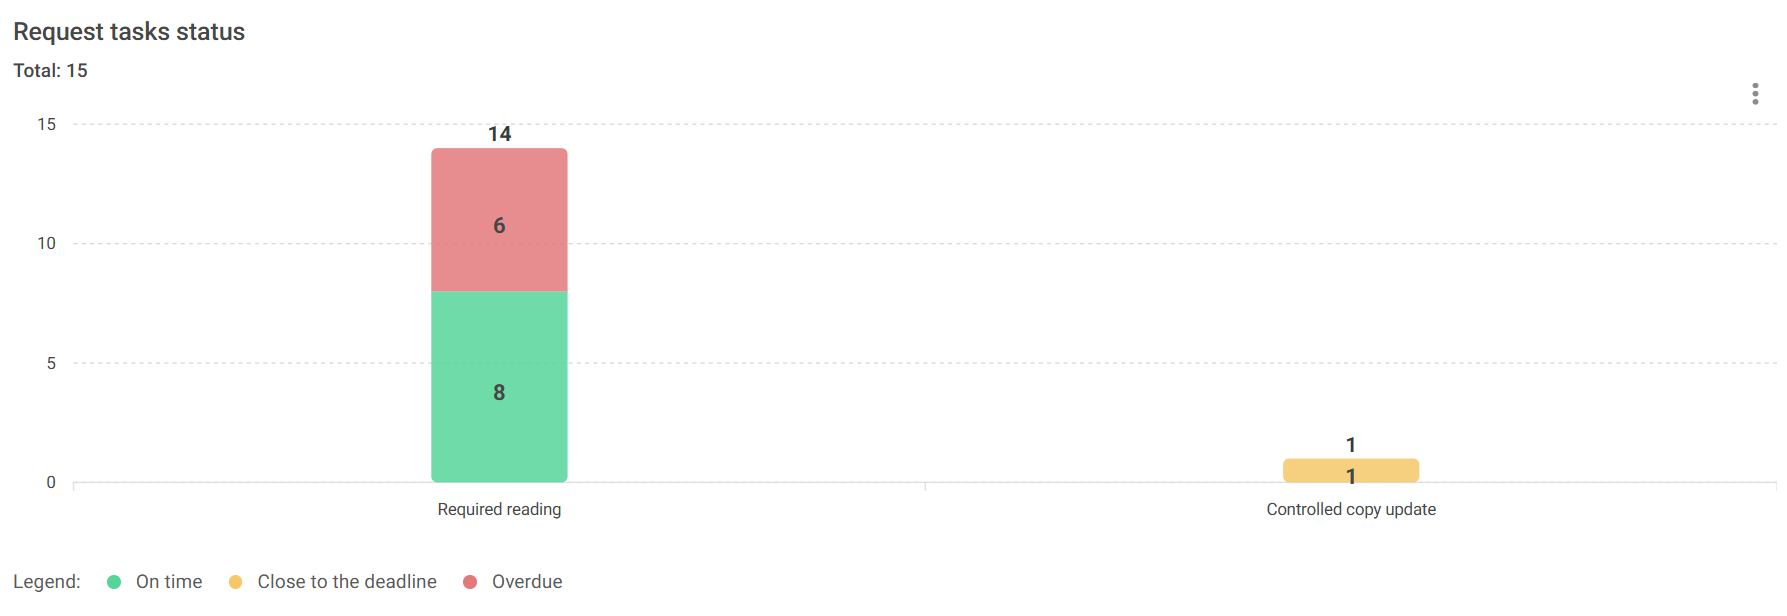
Status of request tasks
Displays pending requests from the Documents module, categorized as follows:
- On time;
- Winning;
- Delayed.
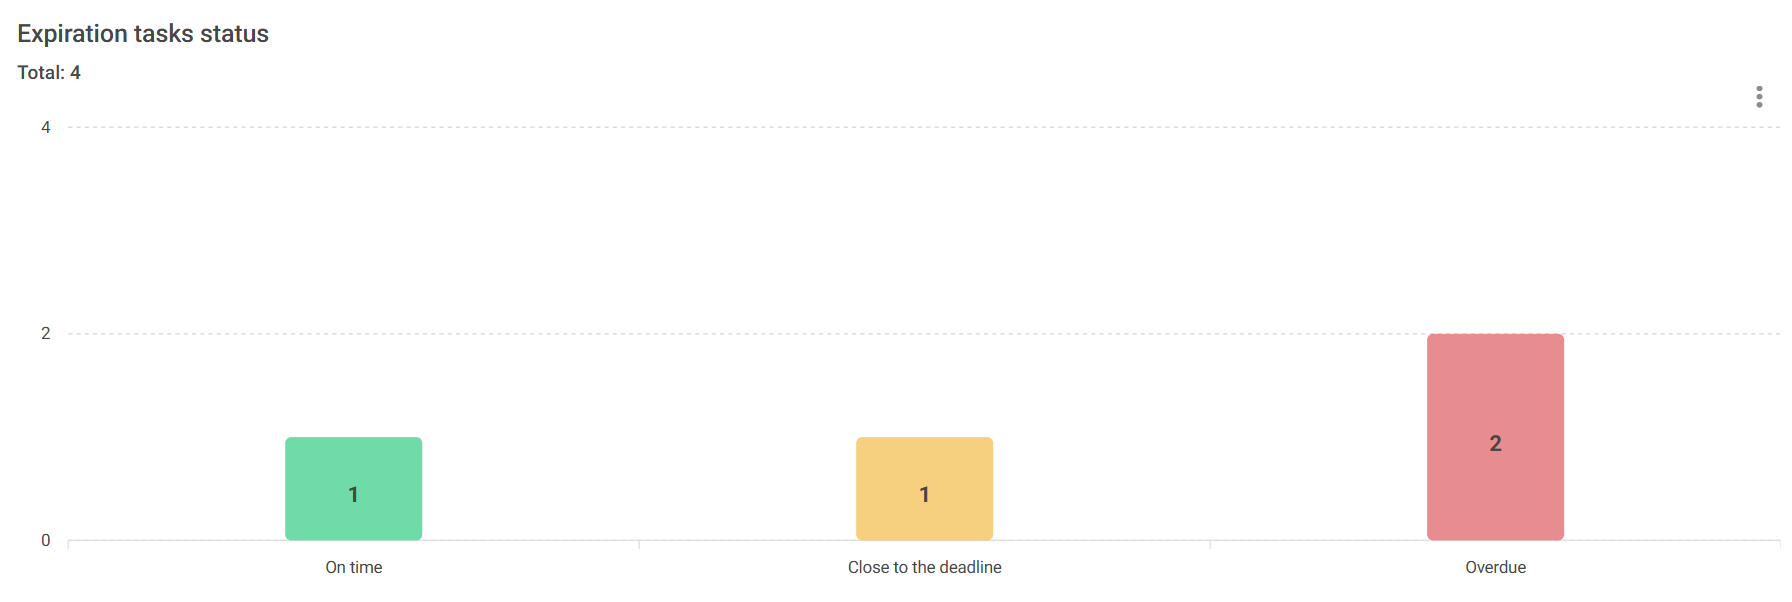
Status of validating tasks
Displays documents that undergo periodic review, classified as:
- On time;
- Winning;
- Delayed.
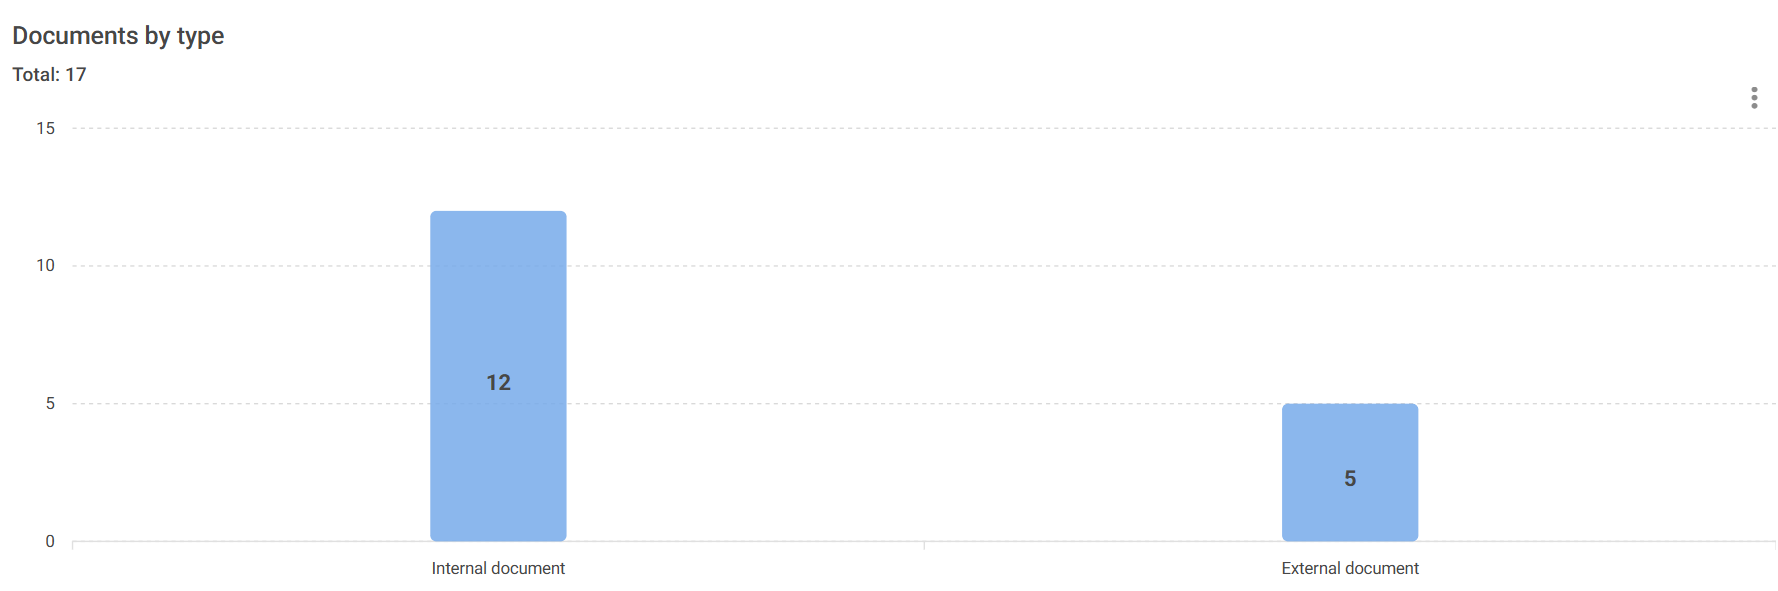
Documents by type
Displays the number of internal and external documents registered.
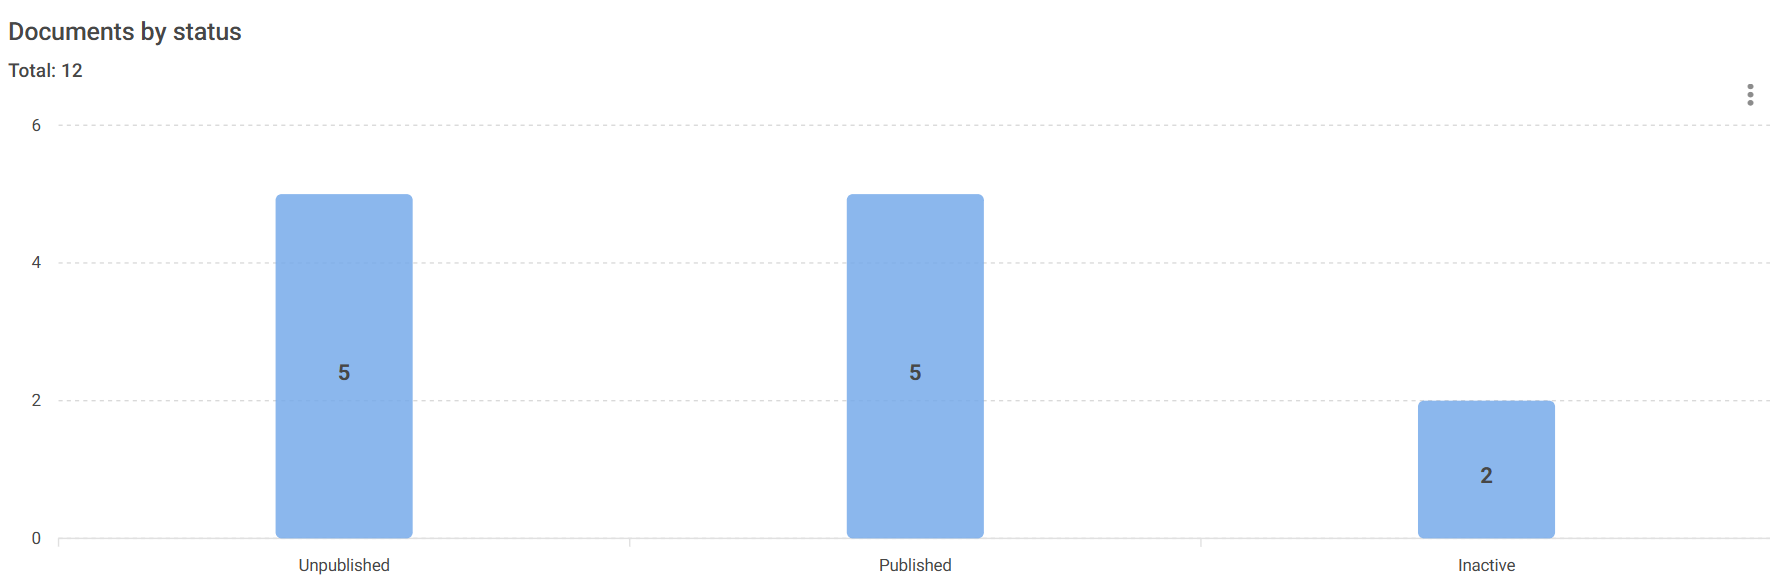
Documents by status
Present the documents according to their status:
- Published;
- Not published;
- Inactive.
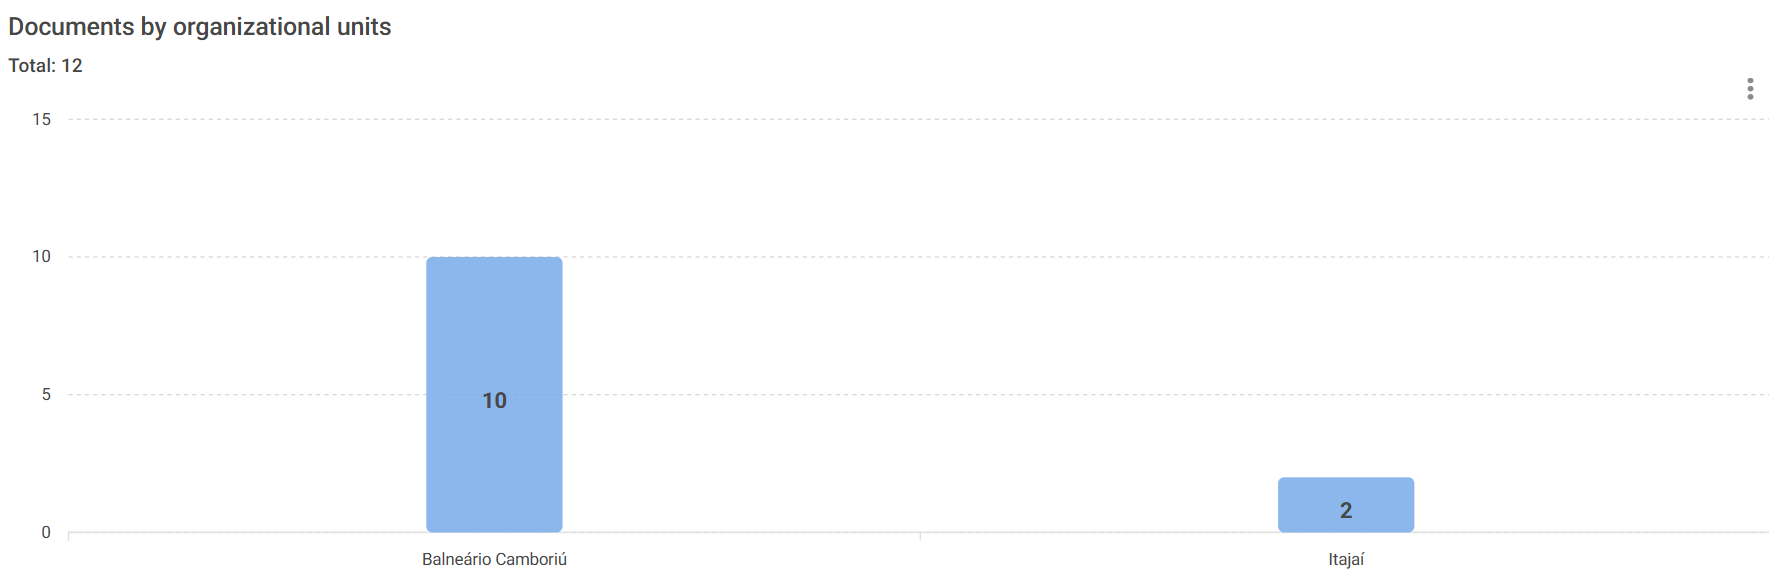
Documents by organizational unit
It shows the distribution of documents among the organizational units.
Documents by process
It shows the number of documents linked to each process.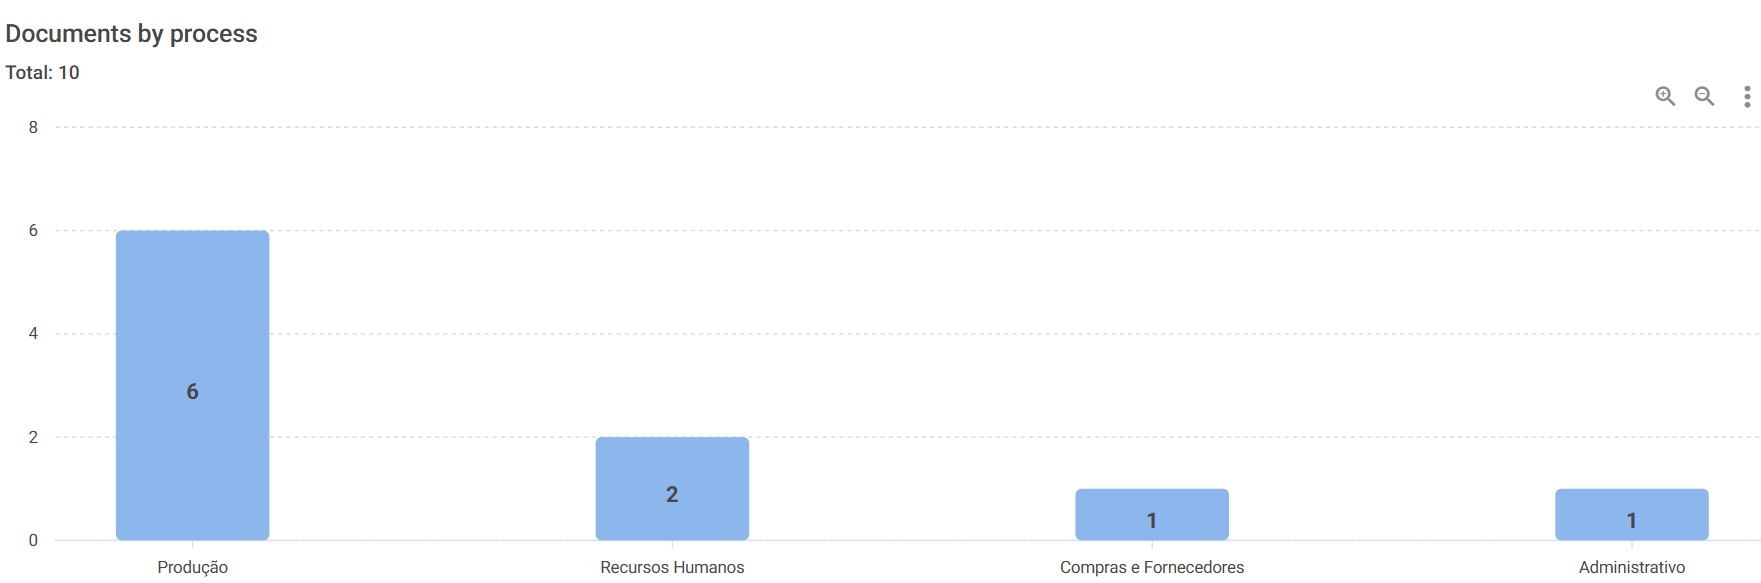
Documents by category
It displays documents grouped by registered category.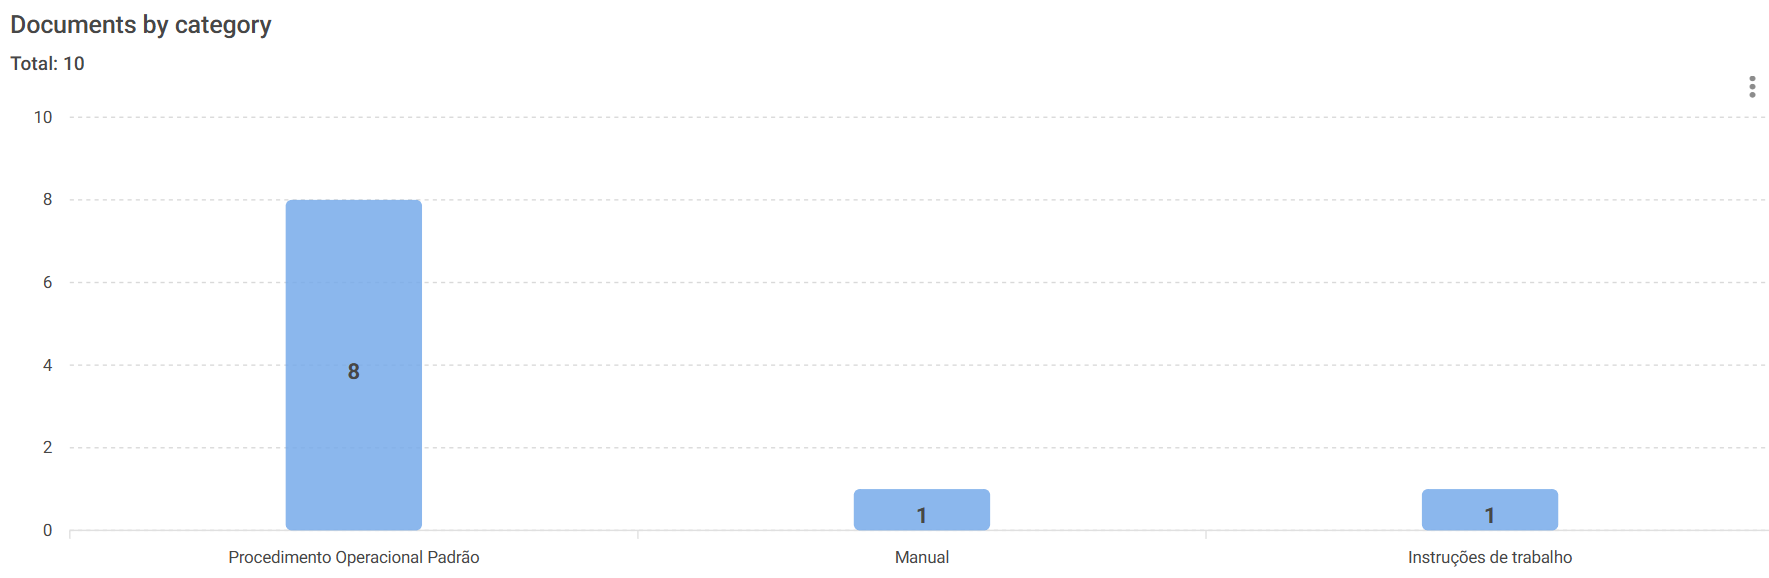
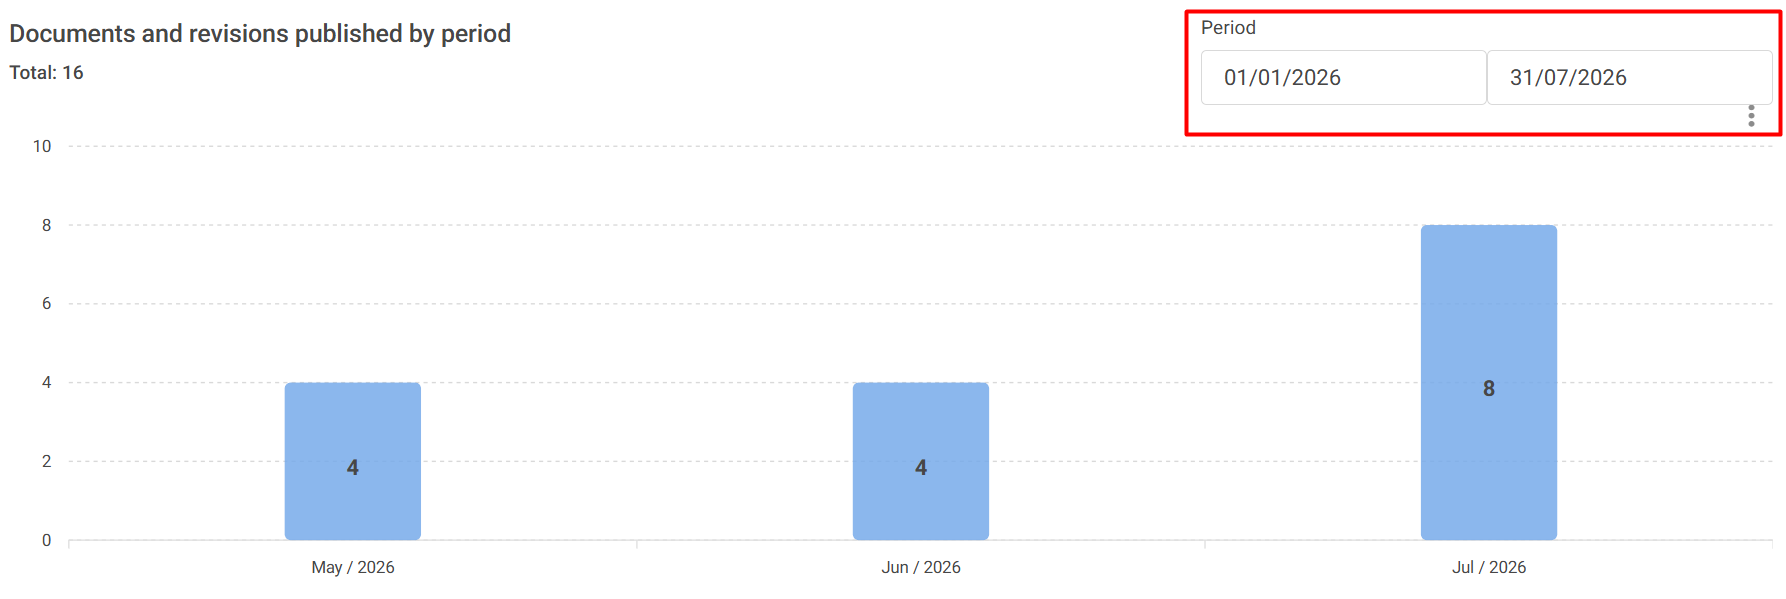
Documents and revisions published by period
Displays the number of documents published and reviewed within the specified period.
To filter the chart, enter the Start Date and End Date .
Additional information
- The applied filters update all charts on the dashboard.
- When you click on an indicator, the system displays the corresponding query.
- All dashboards have additional features in the upper right corner. Click the three-dot icon to export the chart in SVG, PNG, or CSV format.
