The dashboard for the Document Management module was developed to make it easier for users to view the most important data related to documents registered in the system.
Below, we detail each part of the screen to help you better understand the available options:
View Filters
At the top of the screen, you’ll find filters that allow you to adjust the information displayed on the dashboard.

- Organizational Units
Select a unit to view only the data related to it.
- Processes
Filters the improvement opportunities based on the processes registered in the system.
Elaboration tasks status
Refers to the tasks for documents that are being created or revised.
- Drafting
- Approval
- Consensus
Each displays the total number of tasks and their distribution by status, such as:
- On time
Approaching deadline
Overdue
Rejected (when applicable)
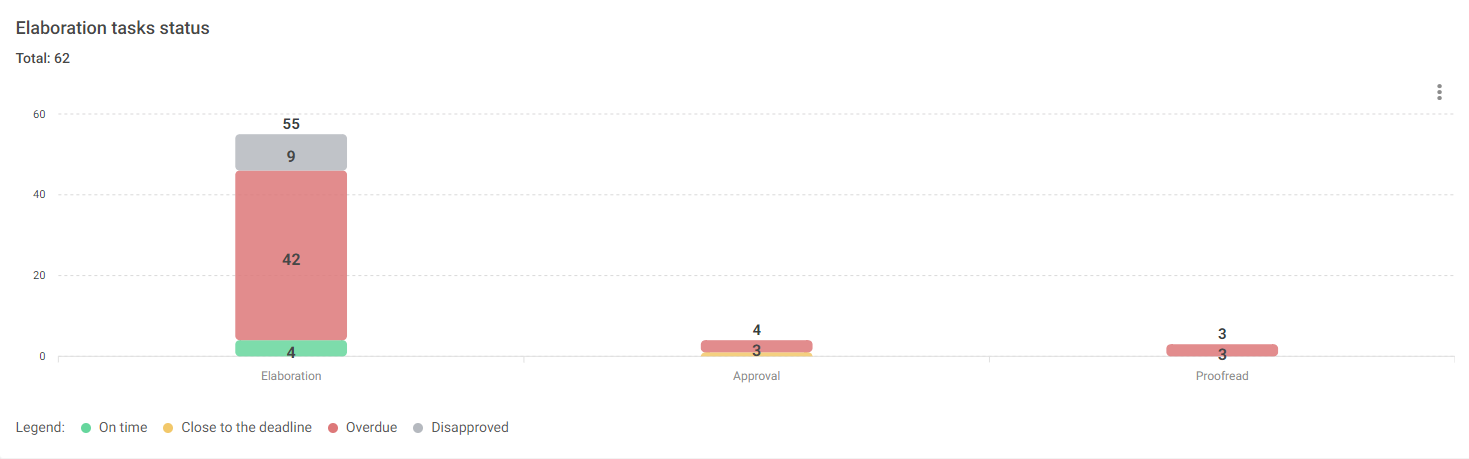
Clicking on any of these options will take you to the query screen, showing more details about the relevant documents.
Request tasks status

This panel shows a summary of pending requests in the Documents module, separated by request type and classified by deadline status using colors: On time, Approaching deadline, Overdue.
Expiration tasks status

This chart presents a consolidated view of tasks related to the periodic validation of documents, meaning documents that require review after a certain time from publication.
They are classified by deadline status, identified by colors: On time, Approaching deadline, Overdue.
Documents by Status

Displays the number of documents that are:
Published: Already available to users.
Unpublished: Under drafting, review, or awaiting approval.
This allows for evaluating how much of the documentation base is currently active.
Documents by organizational units

Shows the number of documents assigned to each unit, such as: Headquarters, SP Branch, RJ Branch, etc.
Helps understand the distribution of documents among departments or branches.
Documents by Processes
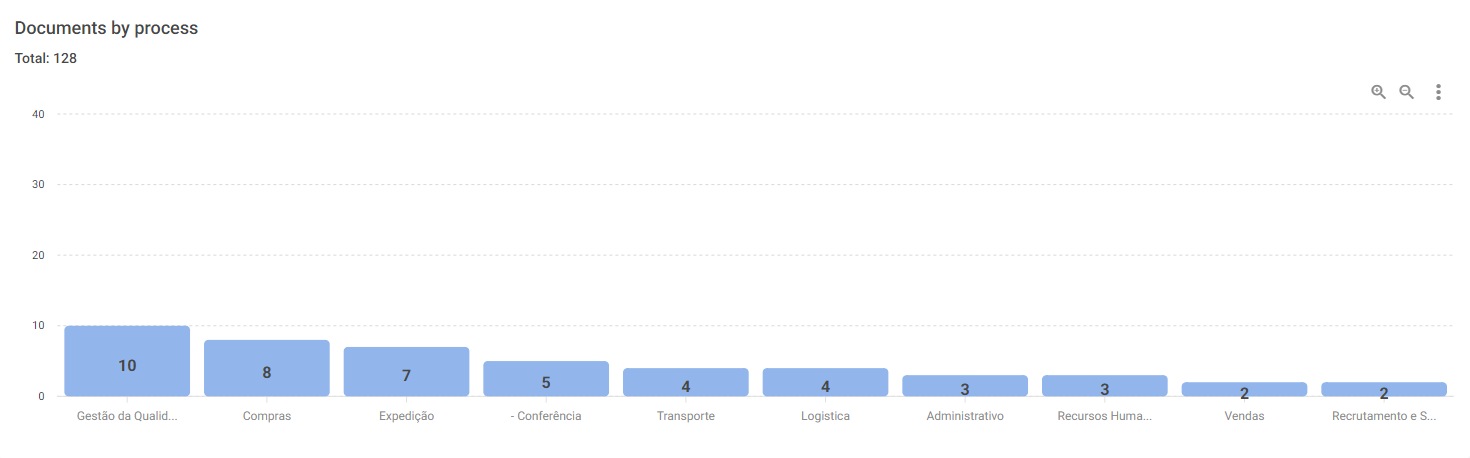
Indicates the number of documents linked to each process registered in the system, for example: Production, Sales, Finance.
Useful for identifying which areas have the highest volume of documentation.
Documents by Category

Classifies documents according to content type:
e.g.: SOP (Standard Operating Procedure), Work Instruction, Policy, Manual, etc.
This allows for evaluating which categories are most used or need attention.
Documents and revisions published by period

A chart that shows the evolution of document publications and revisions month by month.
Helps track document movement over time, such as:
How many documents were published in March?
How many were revised in April?
Additional Dashboard Features

In each dashboard panel, in the top-right corner, there are icons offering extra features to assist with data analysis:
* The magnifying glass with a "+" sign allows you to zoom in on the chart;
* The magnifying glass with a "-" sign allows you to zoom out;
* The vertical three-dots icon opens a menu with the option to download the chart in SVG, PNG, or CSV formats. To export, just select the desired format and click to save it to your computer.
These options are useful for users who want to enlarge the view or export information for presentations, reports, or analyses outside the system.